gillcup.easing
The easing module defines a number of functions usable in
gillcup.Animation.
The functions are partly based on Robert Penner’s Motion, Tweening, and Easing, and on Qt’s QEasingCurve. See their pages for more background.
Each of the functions defined here can be used directly for an
“ease in” animation (one that speeds up over time).
For other types, use attributes: out (slows down over time), in_out
(speeds up, then slows down), and out_in (slows down, then speeds up).
The ease-in is also available in in_. For example,
gillcup.easing.quadratic.in_out is a nice natural-looking tween.
Polynomial easing functions
Other simple easing functions
Easing factories
Helpers for creating new easing functions
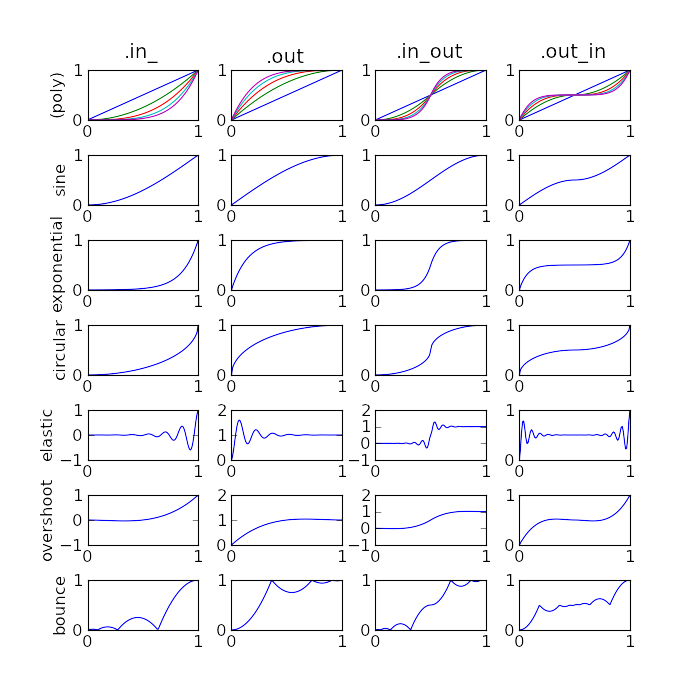
Graph
For some visual reference, here are the graphs of the various functions in this module.
The graph can be generated by running this module directly (i.e.
by python -m gillcup.easing). If a command-line argument is given, the
graph will be saved to the given file, otherwise it will be displayed.
You’ll need to install matplotlib to
create the graph.